Home Portfolio Sales Performance Dashboard
Dashboards

Sales Performance Dashboard

Interactive dashboard tracking revenue, margins and regional performance.

Sample client 2 weeks Completed
Discuss a similar project

Project overview

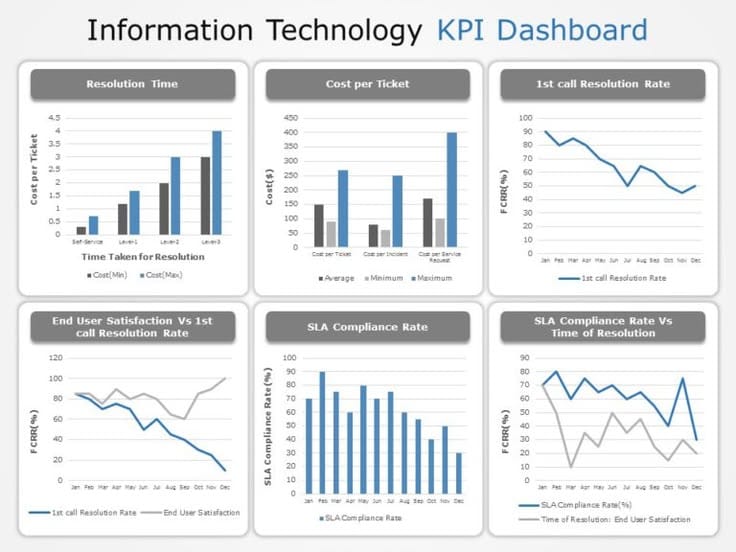
A Power BI dashboard that brings sales data into one view. It shows revenue by month, product and region, highlights the best and weakest performers, and lets managers filter the numbers without asking for a new report.

How we approach projects like this

  1. Understand the challengeWe start with your goals, the questions you need answered and the decisions you want to improve.
  2. Prepare the dataWe organise, clean and validate your data so the analysis starts from a reliable foundation.
  3. Analyse and developWe investigate patterns, build visualisations and test suitable analytical or predictive approaches.
  4. Deliver useful insightsYou receive clear findings, practical recommendations and a walkthrough of the results.

Project visualsClick to expand

Tools used

Power BIExcelSQL
More work

Related projects

View all
Operations KPI Dashboard

Operations KPI Dashboard

One-page dashboard replacing manual weekly spreadsheet reports.

View project

Have a data challenge to solve?

Tell us your goals and we'll find a practical way forward.

Start a conversation