
Data Analysis & Reporting
Turn raw information into clear findings. Explore trends, measure performance and uncover what drives your results.
Insights, reports & recommendationsWe transform complex data into clear insights, useful dashboards and predictive models that help organisations make confident decisions.
From organising spreadsheets to developing analytical models, we help turn information into something your organisation can use.
Turn raw information into clear findings. Explore trends, measure performance and uncover what drives your results.
Insights, reports & recommendationsMonitor the numbers that matter with interactive dashboards and visual stories that make performance easy to understand.
Interactive dashboards & KPI reportsFix missing values, duplicates, inconsistent formats and disconnected spreadsheets so analysis starts from a reliable base.
Clean datasets & data documentationExplore predictive solutions for classification, customer behaviour, risk and other data-driven questions.
Model prototypes & evaluationUse historical patterns to support planning for sales, demand, inventory and other operational measures.
Forecasts, visuals & assumptionsBuild practical data skills and stronger workflows through guided learning in Excel, SQL, Python and Power BI.
Workshops & advisoryGood analysis is more than producing charts. It means understanding the real problem and communicating results clearly.
We start with your goals, the questions you need answered and the decisions you want to improve.
We organise, clean and validate your data so the analysis starts from a reliable foundation.
We investigate patterns, build visualisations and test suitable analytical or predictive approaches.
You receive clear findings, practical recommendations and a walkthrough of the results.
Established tools across preparation, analysis, visualisation and collaboration, chosen to fit each project.
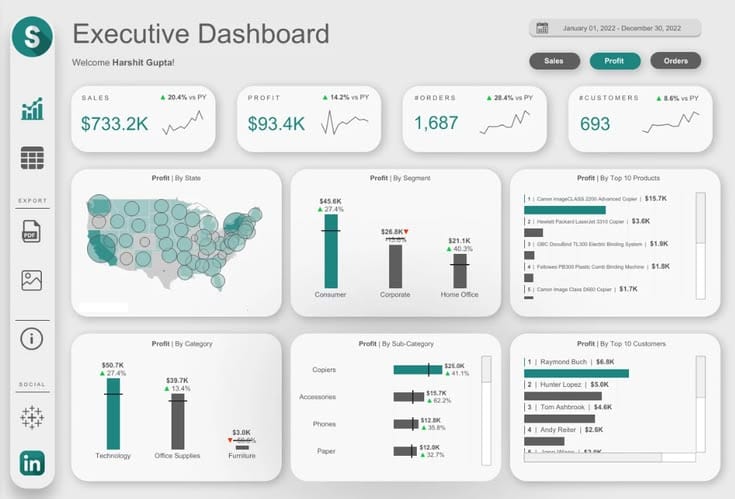
Merging messy spreadsheets into one reliable, documented dataset.
Explore project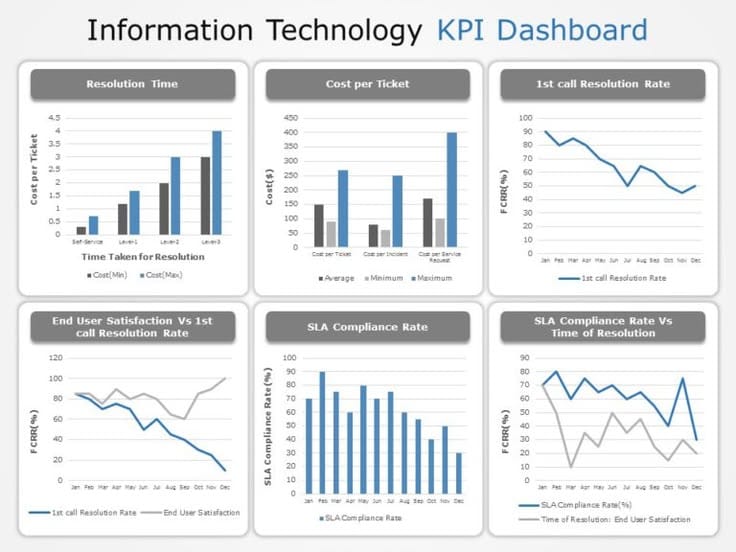
One-page dashboard replacing manual weekly spreadsheet reports.
Explore project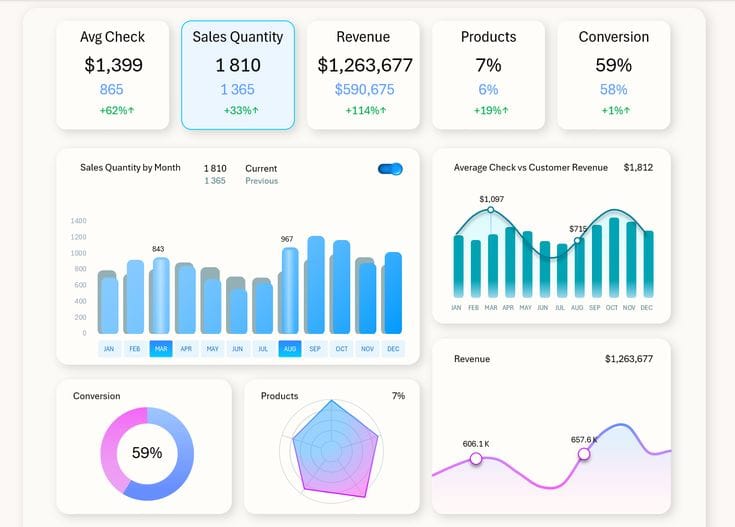
Time-series forecast to support purchasing and stock planning.
Explore projectTell us your goals and we'll find a practical way forward.